Visualizing Culture with the Hofstede's cultural dimensions theory
How can we measure culture?
This was the question Geert Hofstede had in his mind when he started his research. Embarking on a journey that would shape cross-cultural psychology, he crafted a framework comprising six dimensions. These dimensions act as lenses, allowing us to decipher the profound impact of culture on the values held by its members.
The 6 dimensions of culture:
- Power distance index
- Individualism vs. collectivism
- Uncertainty avoidance
- Masculinity vs. femininity
- Long-term orientation vs. short-term orientation
- Indulgence vs. restraint
The beautiful thing about data is its power to unveil, making visible virtually everything we can measure, even intangible elements like culture.
If you are not really interested in what exactly these values represent, you can skip to the data science section.
Also, if you want to see the code, you can check it out here.
What do these indexes represent?
Power distance index
Power Distance measures how willingly less powerful members accept unequal power distribution within organizations and institutions, highlighting societal endorsement of inequality from both leaders and followers.
Individualism vs. collectivism
This index explores the degree of integration into groups within a society, with individualistic cultures emphasizing loose ties and self-reliance, while collectivist cultures foster strong in-groups, often extended families, based on unquestioning loyalty.
Uncertainty avoidance
The Uncertainty Avoidance Index reflects a society’s tolerance for ambiguity. High scores indicate a preference for strict codes, absolute truth, and resistance to unexpected events, while lower scores signify openness to differing thoughts, fewer regulations, and a more free-flowing environment.
Masculinity vs. femininity
In this dimension, masculinity is defined as “a preference in society for achievement, heroism, assertiveness, and material rewards for success.” Its counterpart represents “a preference for cooperation, modesty, caring for the weak, and quality of life.” Women in the respective societies tend to display different values. In feminine societies, they share modest and caring views equally with men. In more masculine societies, women are somewhat assertive and competitive, but notably less than men. In other words, they still recognize a gap between male and female values.
Long-term orientation vs. short-term orientation
This dimension links the past with current and future actions. A lower index values tradition and steadfastness (short-term), while a higher index emphasizes adaptation and pragmatic problem-solving, leading to prosperity in the long term.
Indulgence vs. restraint
This dimension refers to the degree of freedom that societal norms give to citizens in fulfilling their human desires. Indulgence is defined as “a society that allows relatively free gratification of basic and natural human desires related to enjoying life and having fun”. Its counterpart is defined as “a society that controls gratification of needs and regulates it by means of strict social norms”.
Let’s get to the data science part
The data comes from here. Also, if you would like to read more about the Hofstede Model or how the data was collected and dive deeper into the subject, make sure to read the author’s article explaining it by clinking here
The primary challenge posed by this data lies in its multidimensionality. With six dimensions to visualize, we face the need for multiple plots or dimensionality reduction techniques. Considering our familiarity with maps representing countries, a two-dimensional scale may prove effective in illustrating these cultural values.
What is t-SNE?
t-distributed stochastic neighbor embedding is a nonlinear dimensionality reduction technique that excels in revealing underlying patterns and structures within high-dimensional datasets. Unlike traditional techniques that may distort relationships, t-SNE aims to preserve the local and global similarities between data points, making it particularly suitable for visualizing cultural dimensions.
How Does t-SNE Work?
At its core, t-SNE minimizes the divergence between two probability distributions: one that measures pairwise similarities between data points in the high-dimensional space and another for the low-dimensional space.
The optimization objective is to find a low-dimensional representation that minimizes the Kullback-Leibler divergence between these two distributions.
The pairwise similarities are defined using a Student’s t-distribution in the low-dimensional space, allowing t-SNE to focus on preserving the relative distances between points.
Why t-SNE in Cultural Analysis?
The cultural dimensions outlined by Hofstede’s theory span six diverse metrics, creating a challenge for traditional visualization methods. By employing t-SNE, we can transform this intricate multidimensional space into a two-dimensional representation. This allows us to explore relationships between countries, identifying clusters that share similar cultural traits and unveiling subtleties that may remain obscured in higher-dimensional views.
With the dimensionality reduction provided by t-SNE, our plot is almost ready. But there is one more thing we have to decide, which is the color.
How should we color the plot
Since we are plotting countries on a map, we should not entirely get rid of the geographic aspect of it, so the map is colored based on the continent each contry is in. This way we can find interesting links between countries with similar cultures, but entirely different geographic locations. To do this, I used the pycounty_convert python package.
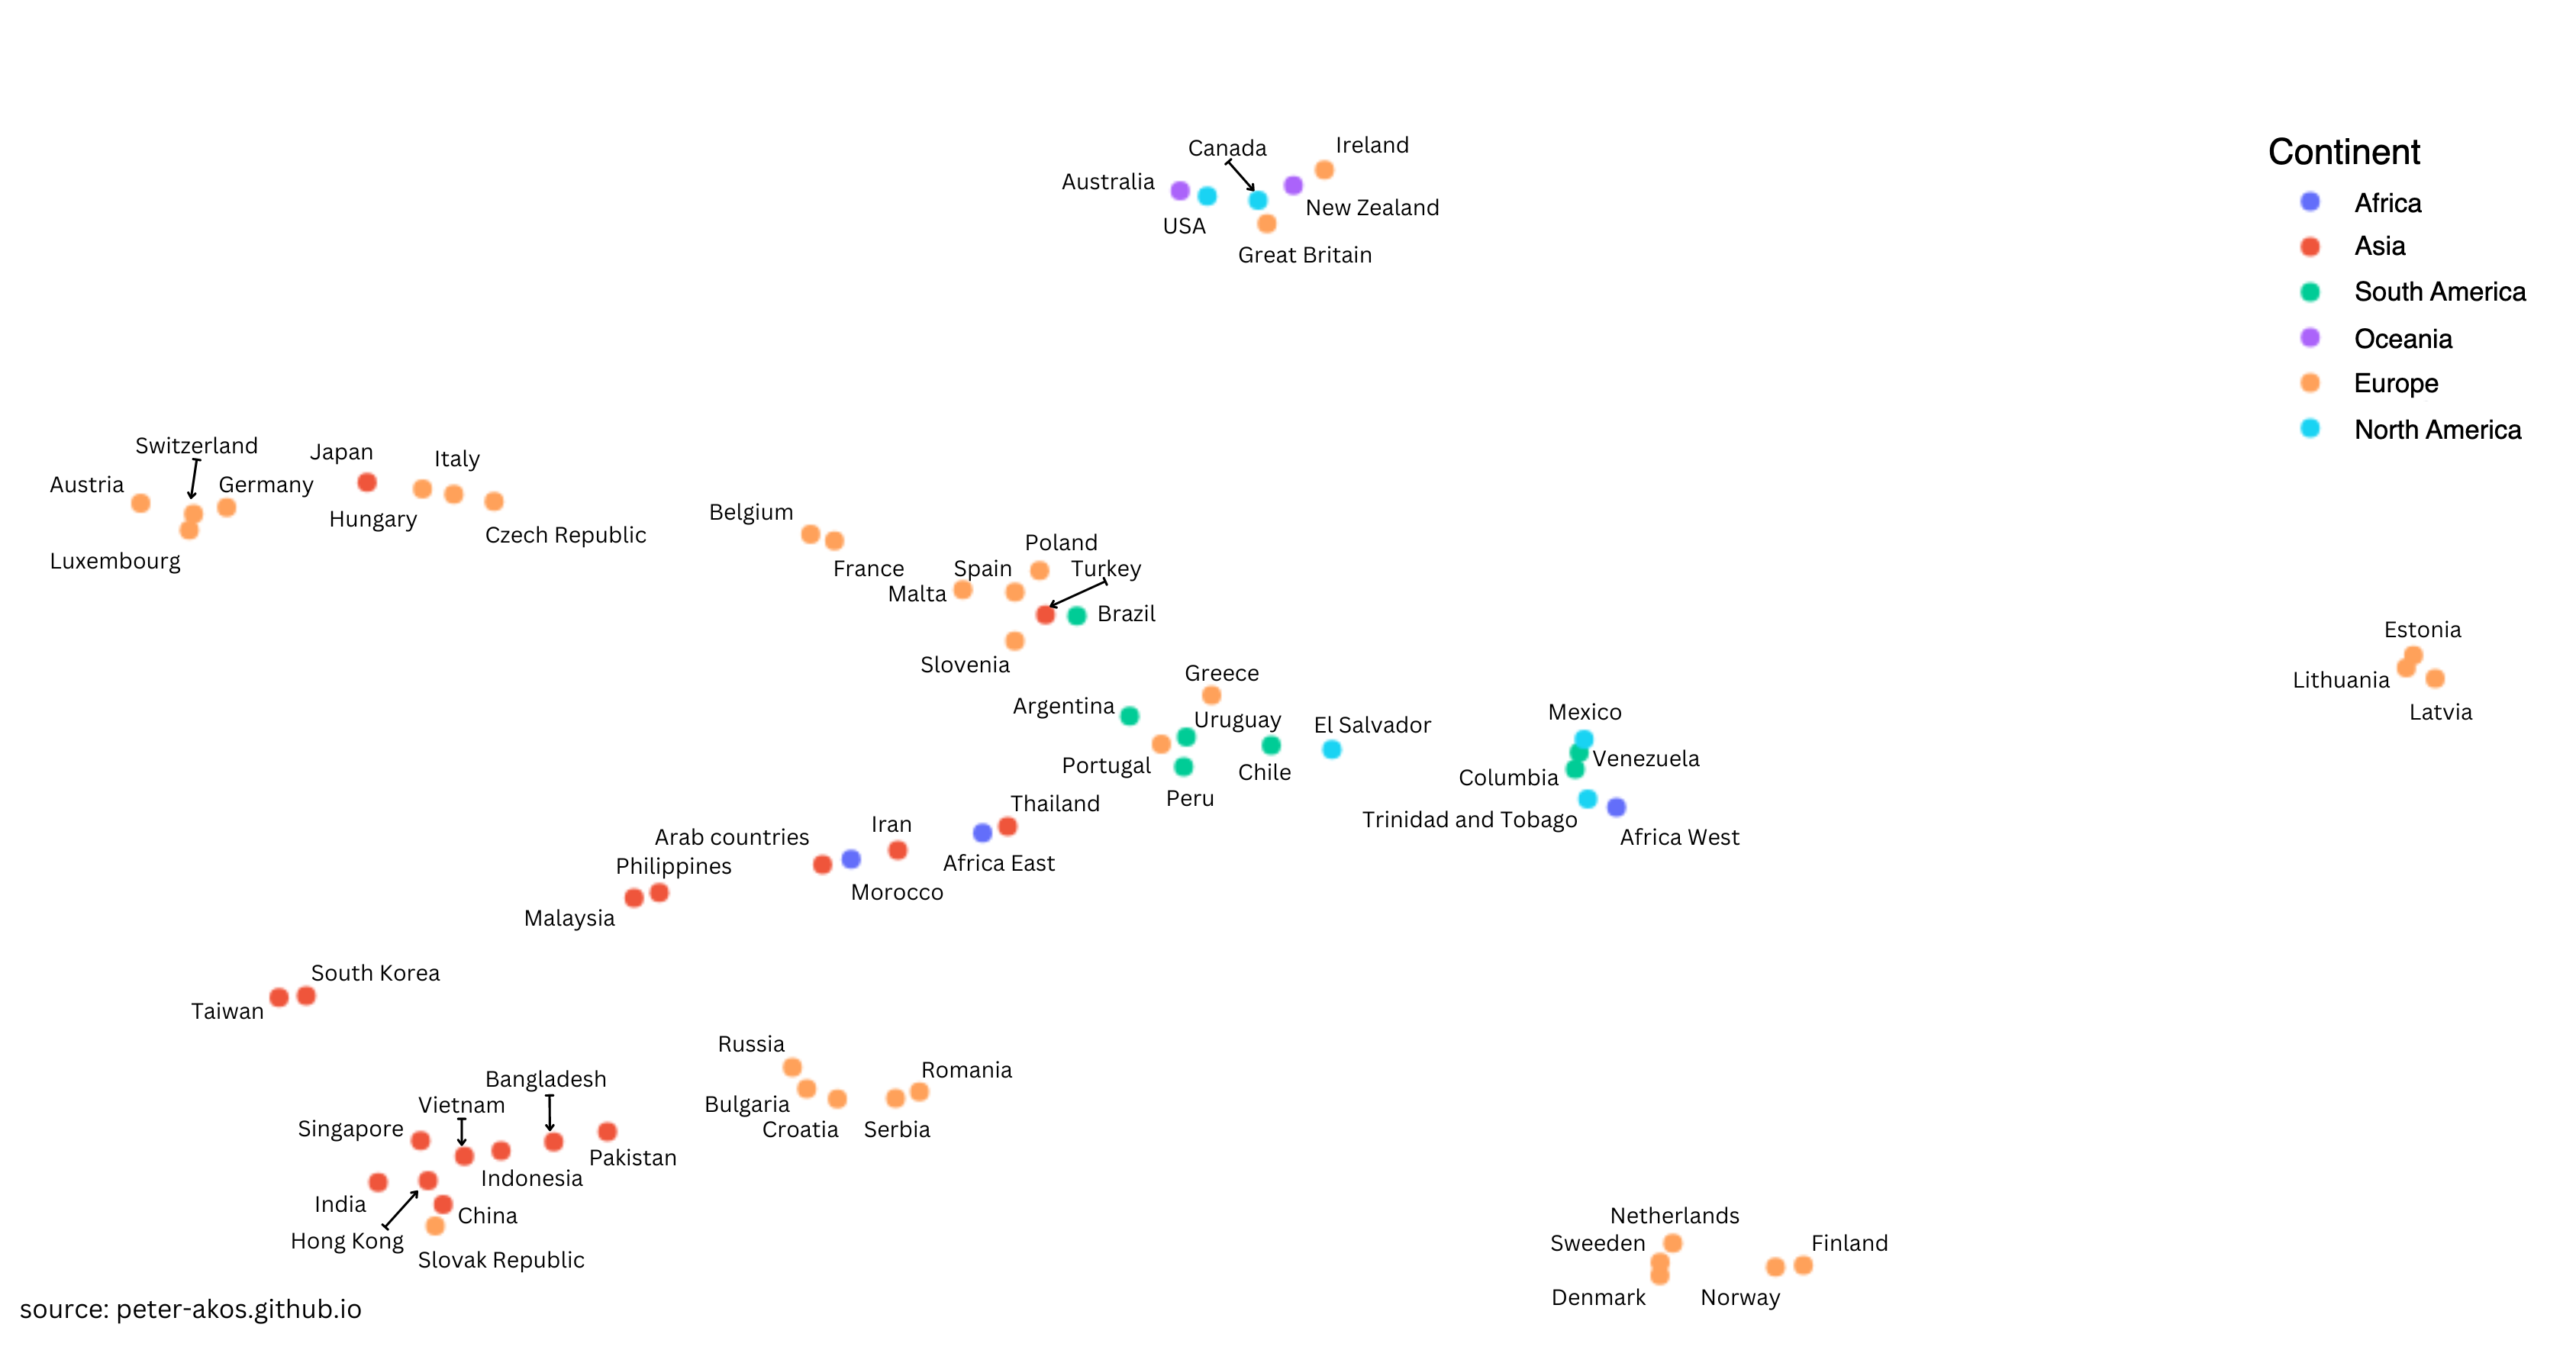
The final plot
If you are on mobile, the plot might be too small, so you can check it out by clicking here.
The clusters
- English-speaking countries: Australia, Canada, Great Britain, Ireland, New Zealand, USA
- Nordic counties: Denmark, Finland, Netherlands, Norway, Sweden
- Baltic countries: Estonia, Latvia, Lithuania
- Western and Central Europe: Austria, Belgium, Czech Republic, France, Germany, Hungary, Italy, Luxembourg, Switzerland
- Balkan countries: Bulgaria, Croatia, Serbia, Romania. Russia is also part of this cluster indicating that culturally it is close despite being far geographically
- The East: Bangladesh, China, Hong Kong, India, Indonesia, Malaysia, Pakistan, Philippines, Singapore, South Korea, Taiwan, Vietnam
- Latin America: Argentina, Brazil, Chile, Colombia, El Salvador, Mexico, Trinidad and Tobago, Uruguay, Venezuela
- Islamic countries: Africa East, Iran, Morocco
Interesting results
- Japan surrounded by european countries
- Turkey and Brazil being so close to each other
- Slovak Republic with Asian neighbours
Wait, don’t we have another unused dimension
Sure, we could also plot them in 3d. If you want to see that, click here.
Thank you for getting to the end, I hope you liked it. If you have any questions or comments, feel free to write them to me.