Our Team has Qualified for the Finals of the Morgan Stanley Quant Challenge
I’m happy to announce that our team, Compacto has qualified for the finals of the Morgan Stanley Quant Challenge. Being part of the 8 best teams out of more than a hundred makes me so proud of the amazing people that I worked with in the last few weeks and I want to share what we’ve been working on.
Let’s start by introducing the team
-
Ács Hunor: Responsible for the data visualizations.
-
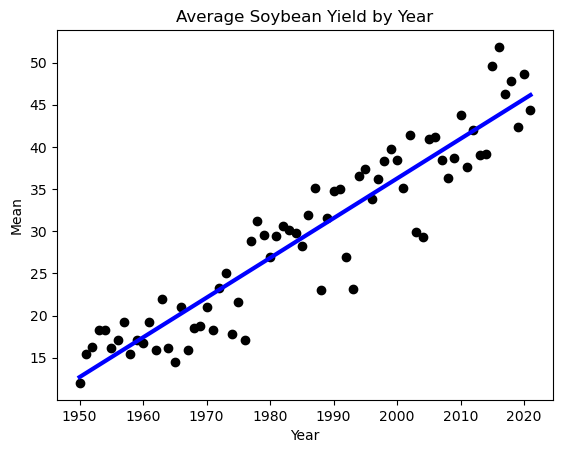
Magyari-Sáska Attila: Responsible for the model for soybeans.
-
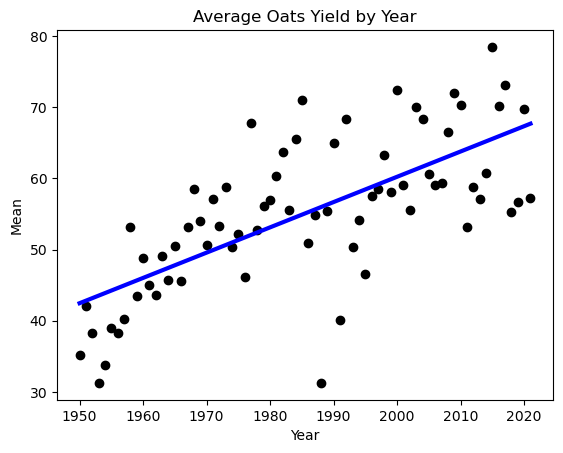
Gagyi Levente Lóránt: Responsible for the model for oats.
-
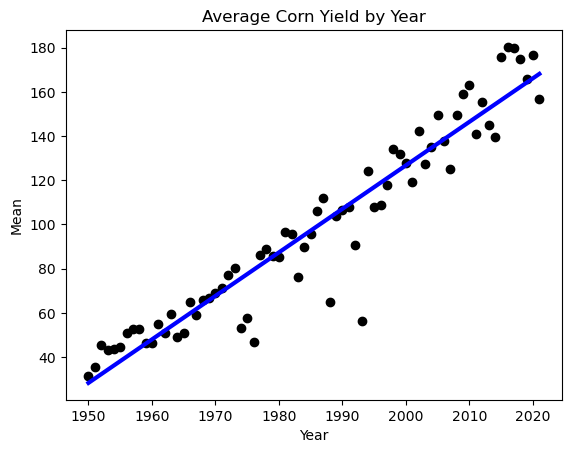
Péter Ákos: I was responsible for the corn model and for managing the project.
The problem
The task was to predict the yield for corn, soybeans and oats under multiple weather scenarios, based on historical data.
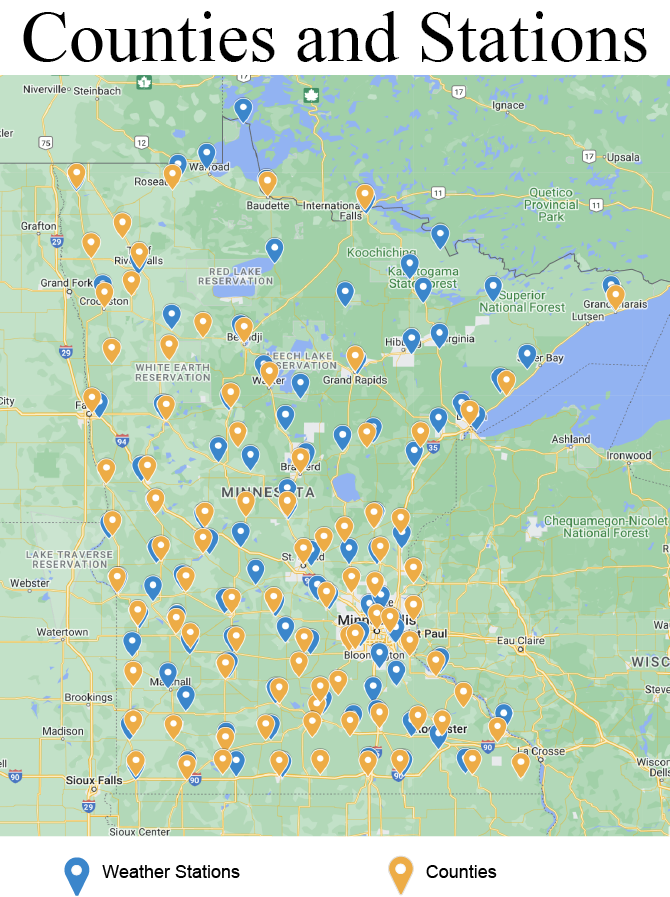
We were given coordinates to weather stations and the data recorded by them, in some cases going back more than a century. Also we received coordinates to counties and data about the yearly crop yield for oats, soybeans and corn.
We also received some example weather scenarios and our task was to predict the yield for corn, soybeans and oats.
Our Solution
To tackle this challenge, we had to create a model that works like this: weather scenario -> crop yield
We decided to go with 3 separate models for the 3 different types of crop: corn, soybeans and oats.
1. Using as much data as we can
Our first problem was matching the weather stations to the counties. The data at the stations contained a lot of missing values and since they weren’t build at the same time, recorded data from different times. To use as much data as we can, we decided to do it the following way:
- get the closest 4-5 stations to each county
- for each year, check if data exists for the given station
- take the average of the stations that had data
This way we can use most of our data, while ensuring that the data that we use is relevant, since being close to the place the crop was harvested at.
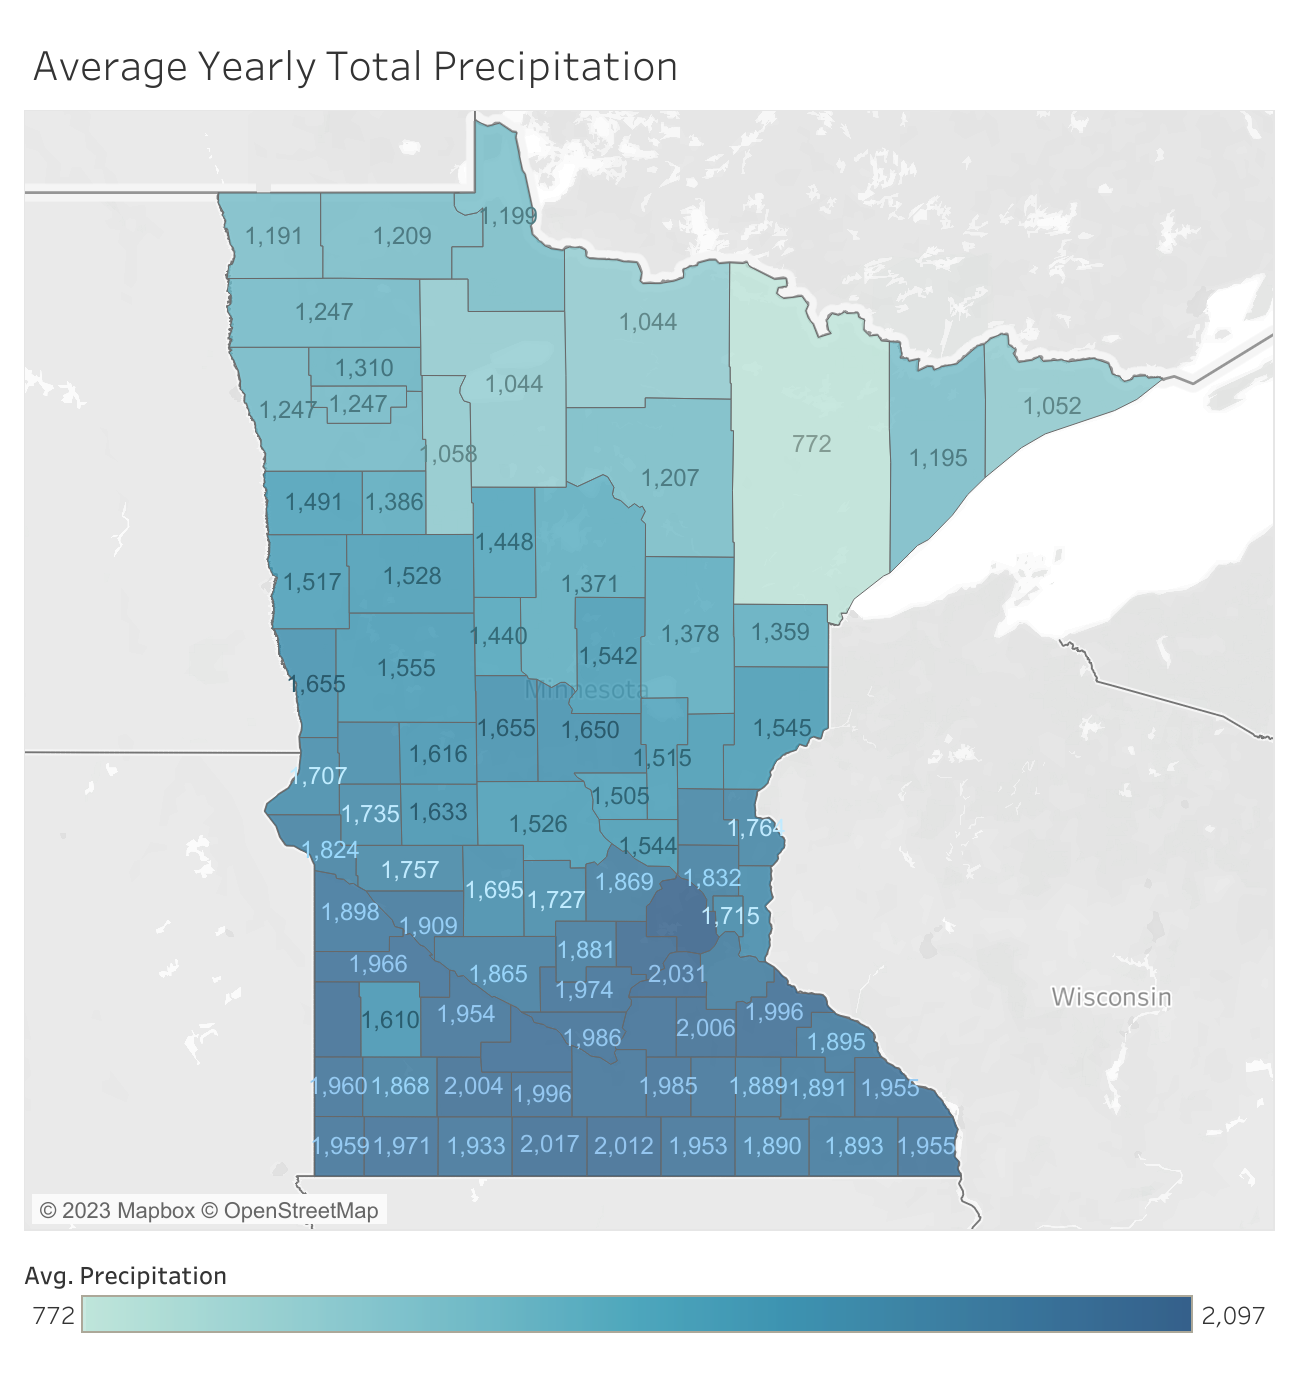
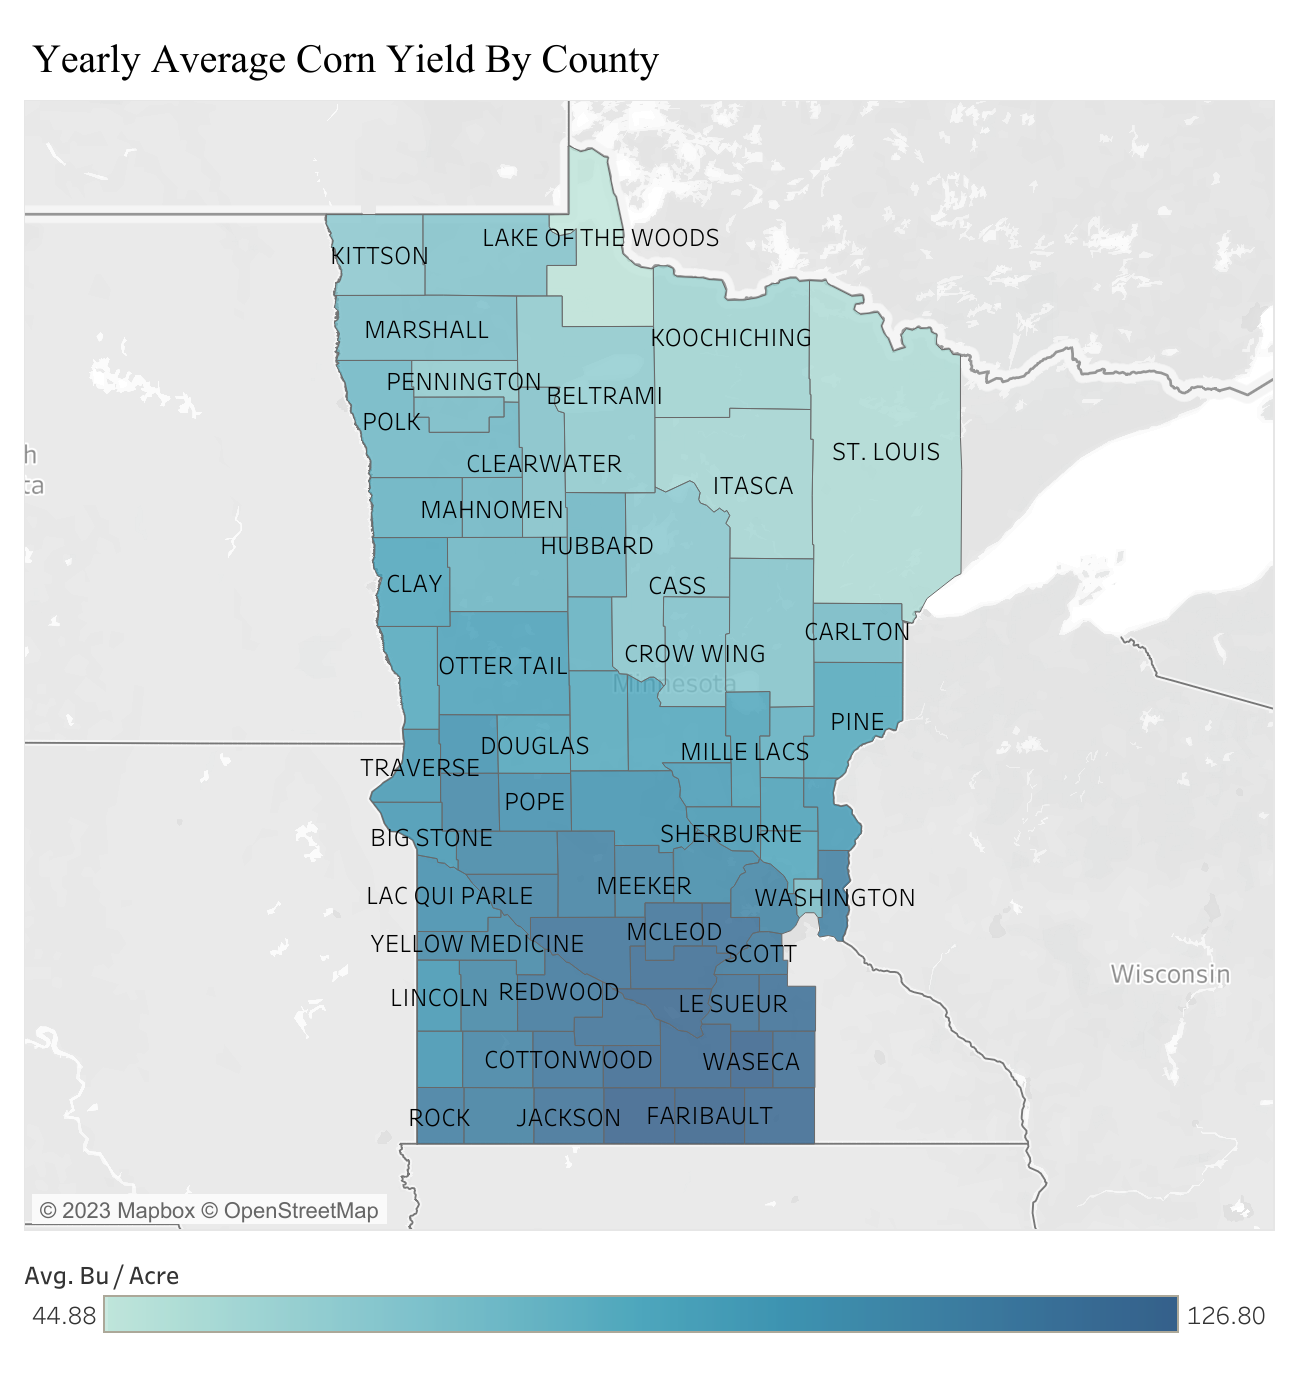
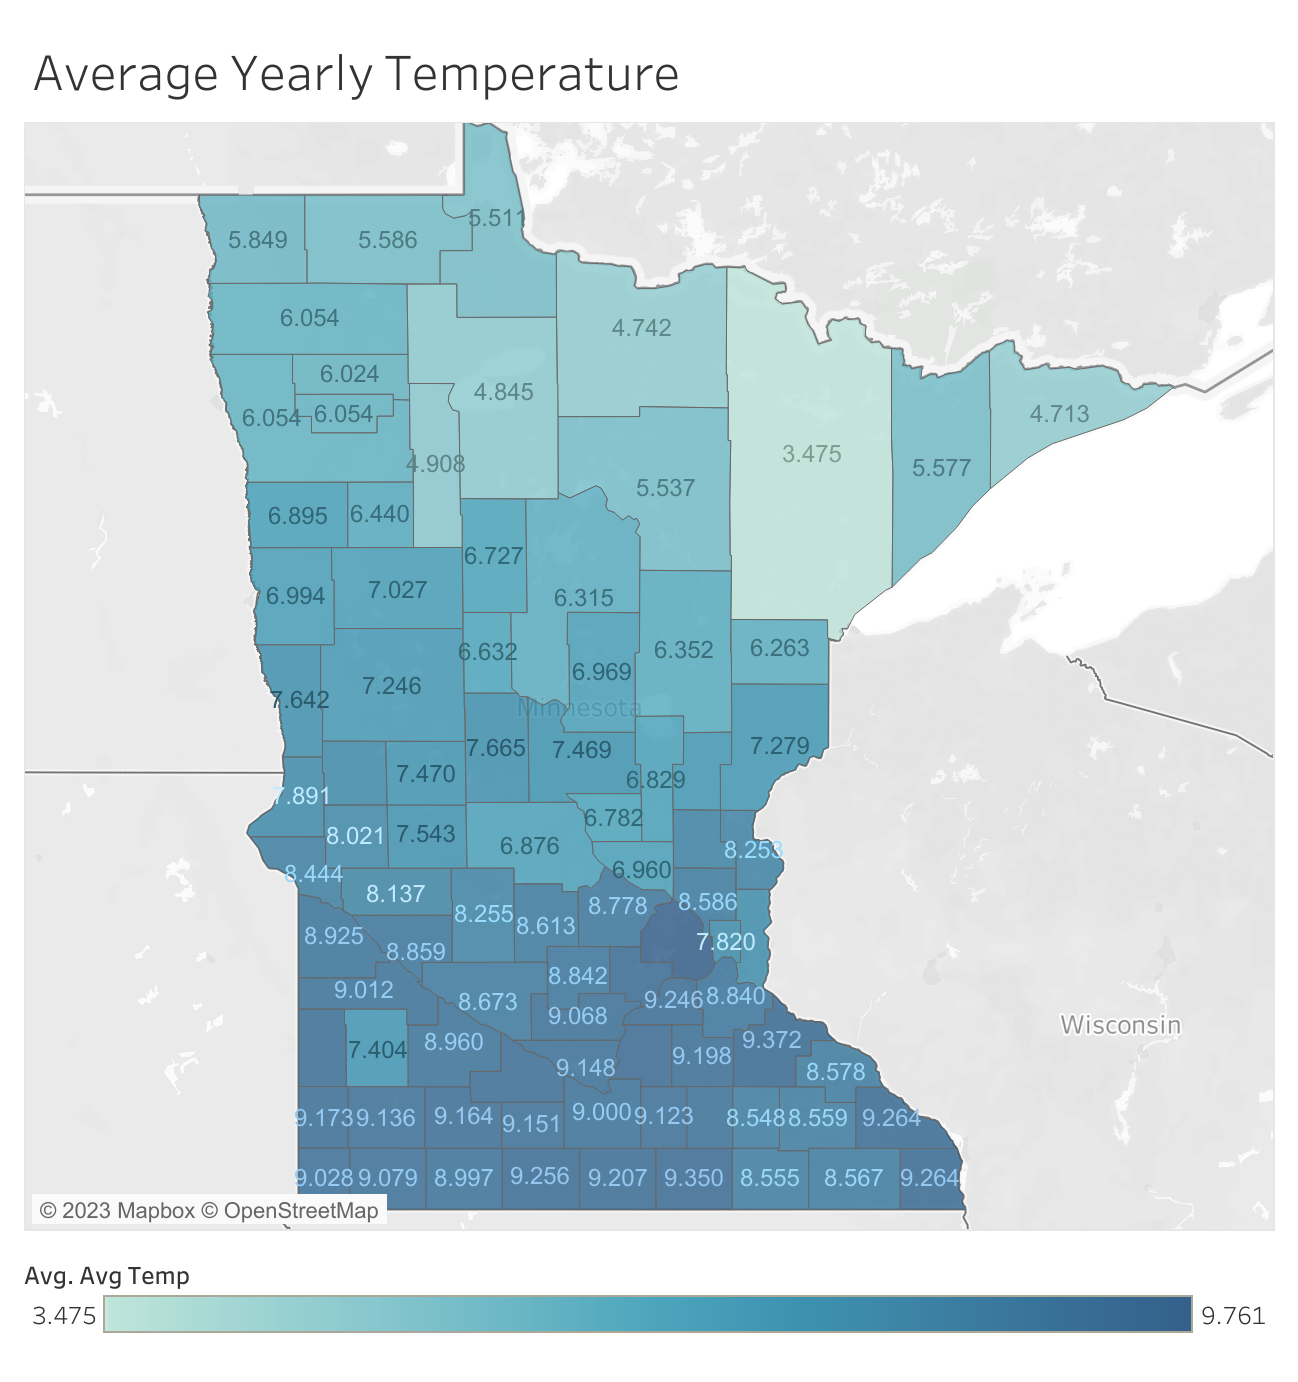
There exists a clear relation between the weather and the yield, higher temperatures and more precipitation leads to higher yield.
2. Cleaning the data of other biases
If we plot the yearly average yield, we can see that as it got better and better with time. This is due to better technology: seeds and fertilizers. When we train the models, we want the input data to only contain the variability of the weather, so that our model learns to predict based on the weather, not based on the year.
To do this, we fit a linear regression on the yearly average yield for each of the crops and substract from each yield the slope times the years to 1950, since our data starts then.
3. Training the models
We trained a bunch of models:
- Linear Regression
- Perceptron
- Gradient Boosting
- Long-Short Term Memory
Here are the results for corn:
| Model name | Mean-Squared Error | R-squared |
|---|---|---|
| Linear Regression | 2.24e+22 | -1.07e+19 |
| Perceptron | 219.222 | 0.871 |
| HBGB | 248.969 | 0.917 |
| LSTM | 25.57 | 0.925 |
And here are the losses for the LSTM:
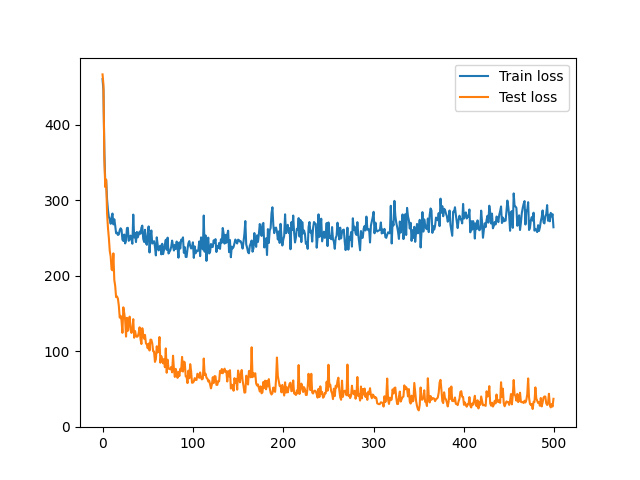
In the end we ended up choosing the Long-Short Term Memory, since that was the most accurate.
If you want to learn more, please read the paper or check out the repository on github.
If you have any comments or questions, feel free to write it to me.